Calculation methods: six presets, four cities, 2027
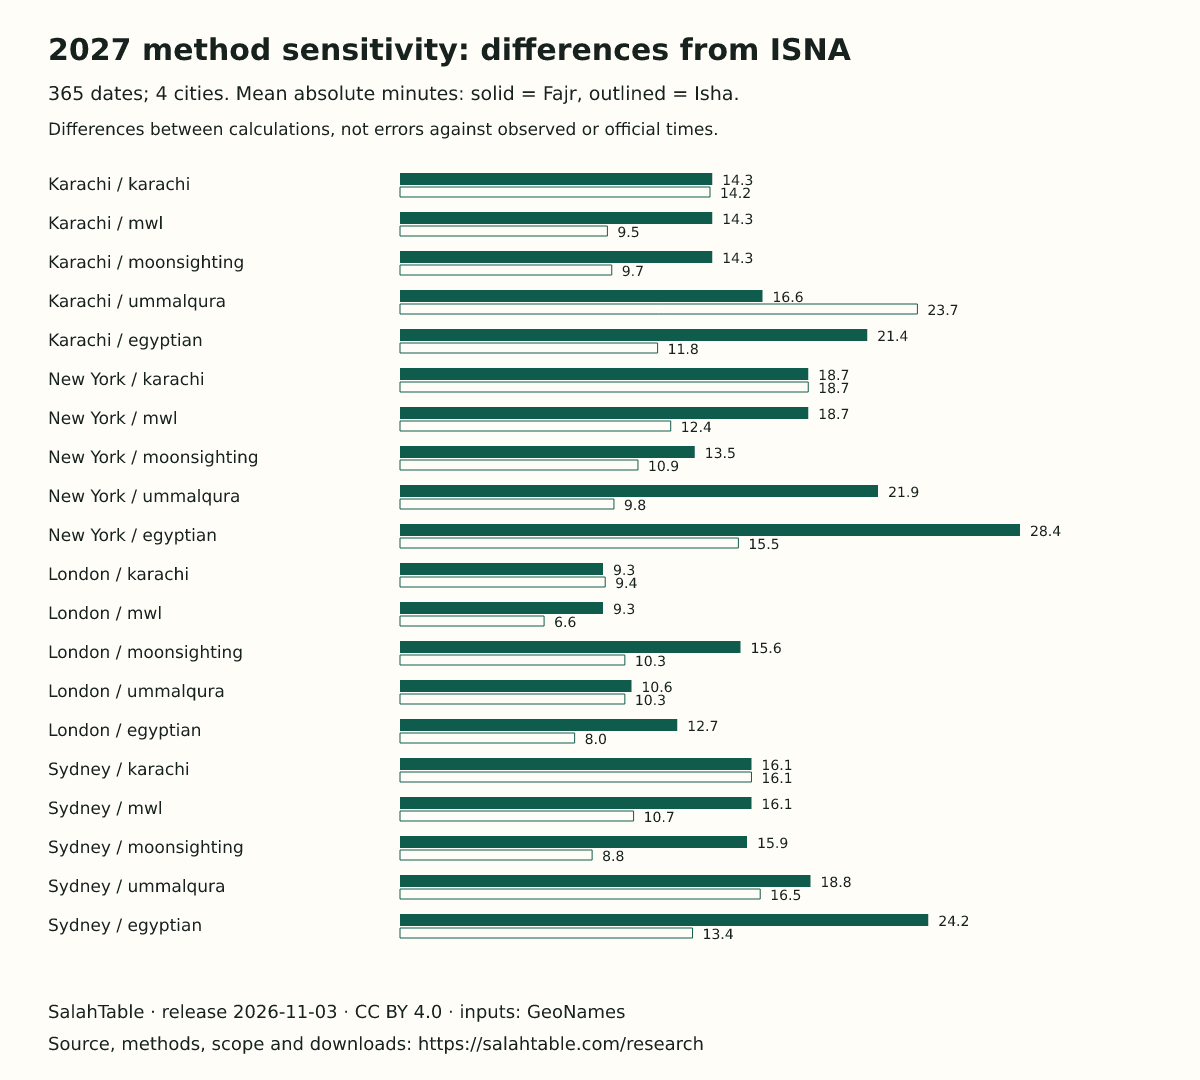
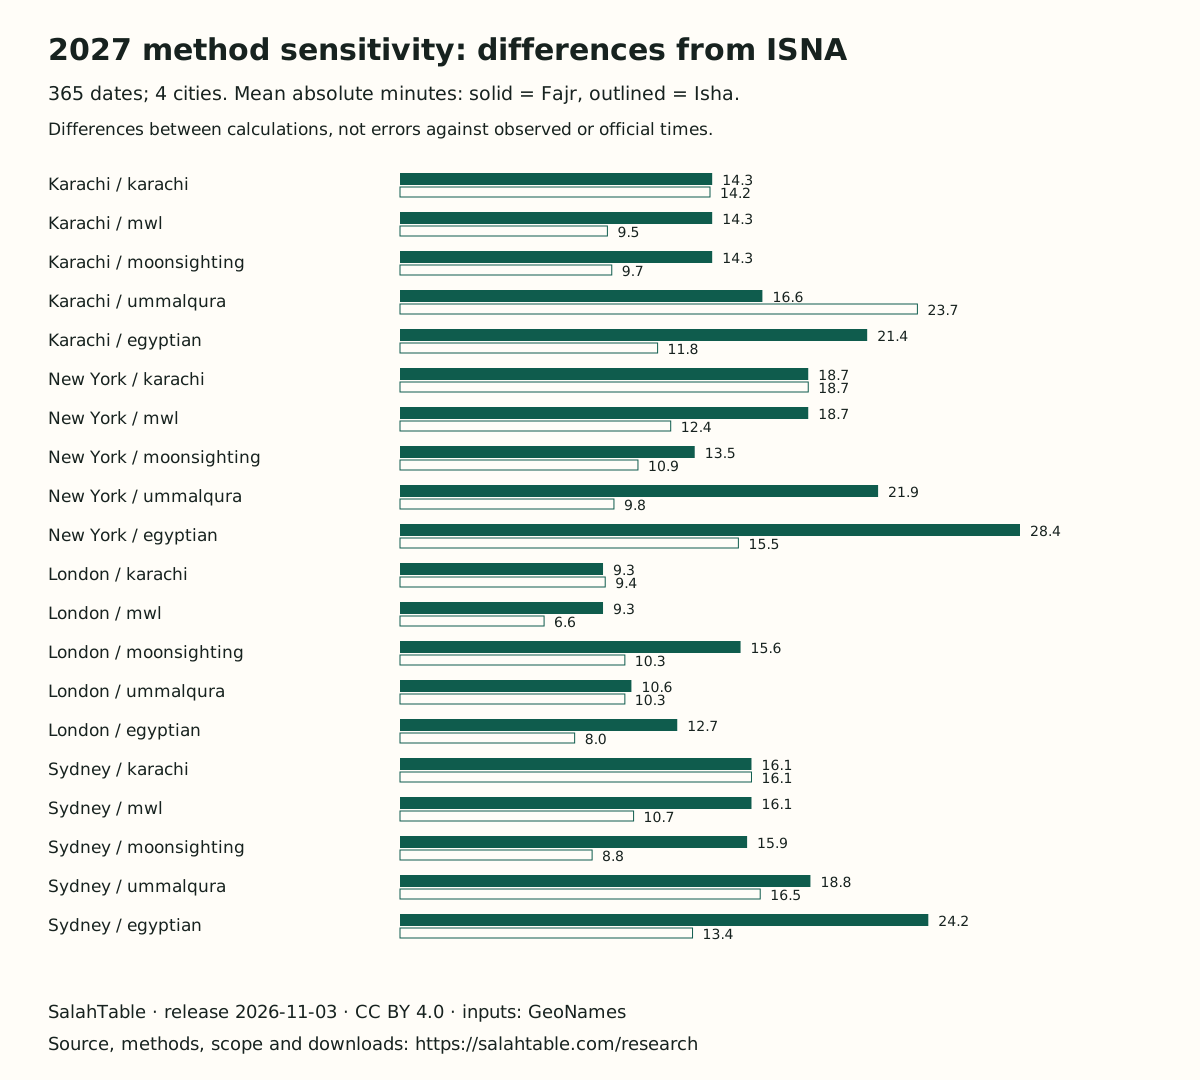
The study compares every date of 2027 with ISNA as the common baseline. The chart shows mean absolute Fajr and Isha differences; it is a sensitivity comparison, not an accuracy ranking.
- Full study and limitations
- Download comparison CSV · Download chart SVG · Download chart PNG
- Summary JSON, including seasonal curves and extreme dates
Ramadan 2027: first-date fasting durations
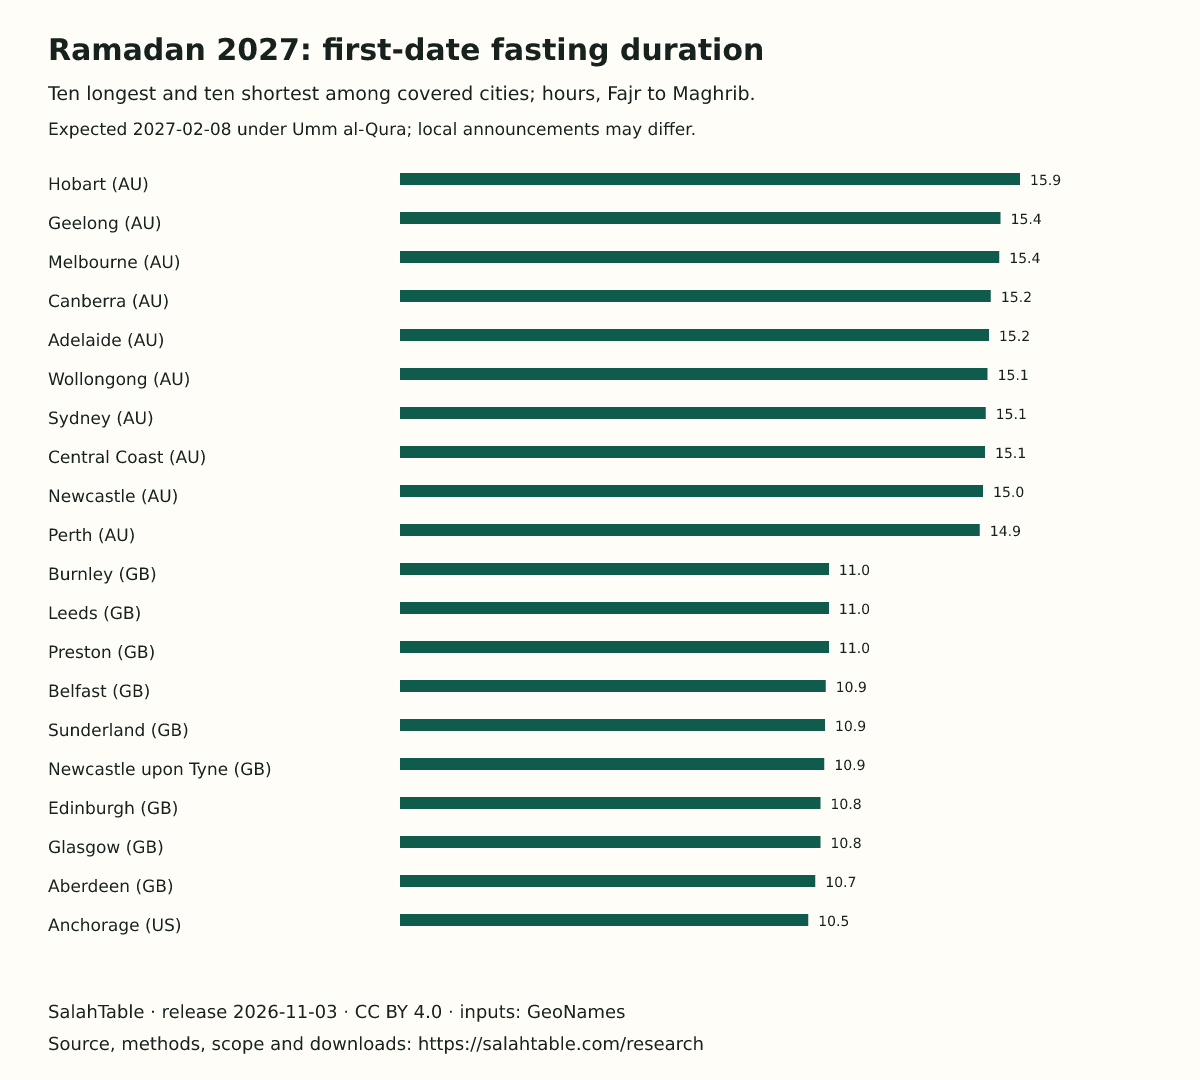
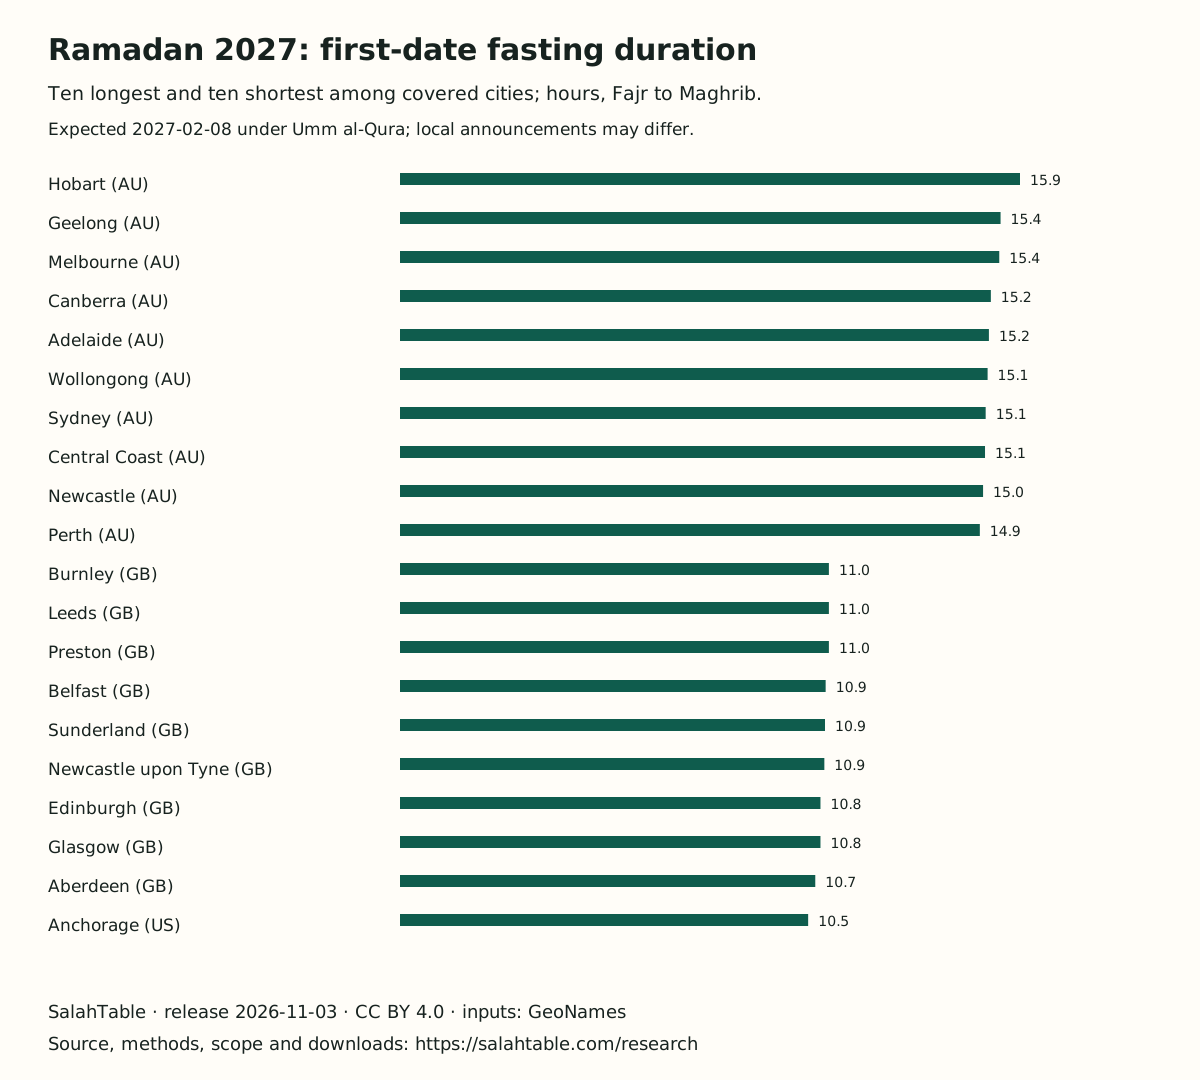
The CSV covers every city currently supported by this site. The chart selects ten longest and ten shortest durations on the expected first Gregorian date under Umm al-Qura. This is not a ranking of the longest fast anywhere in the world or the longest day of the month. Local Ramadan announcements can differ.
- Full city table and calendar assumptions
- Download fasting-duration CSV · Download chart SVG · Download chart PNG
License and suggested citation
Our original charts and derived CSVs on this page are available under CC BY 4.0. Credit SalahTable, link to the source and license, and indicate changes. City inputs are adapted from GeoNames. Third-party source timetables linked on the accuracy page retain their own rights.
SalahTable (2026). Prayer time research: 2027 calculation-method comparisons and first-date Ramadan fasting durations (Research release 2026-11-03) [Calculated data and charts]. https://salahtable.com/research.
For a specific chart, also name the chart, its scope and selected method or baseline. A suitable credit is: “Calculated by SalahTable, research release 2026-11-03, CC BY 4.0; modified by [your name]” with a link to this page.
The research release identifier is separate from the archived daily dataset's Version 1.0.0. Do not assume they contain the same city set.
Check the evidence
Dated publisher comparisons show agreement and discrepancies with mosque and media schedules. Seasonal curves distinguish weekly plotting points from daily-derived extreme dates.